
Role of Diagrams and Flowcharts in UPSC Mains: How Visual Presentation Boosts Your Score
The UPSC Civil Services Mains Examination is not just a test of knowledge—it is a test of presentation, clarity, and time management. Every year, thousands of aspirants write similar content, yet only a few secure high marks. One of the most decisive differentiators between an average and a high-scoring answer is the effective use of diagrams, flowcharts, and visual tools.
In recent years, UPSC evaluators have increasingly appreciated clear, concise, and visually structured answers. Diagrams and flowcharts help candidates communicate complex ideas quickly, making answers easier to evaluate and more impactful.
This article explains why diagrams and flowcharts matter in UPSC Mains, where to use them, how to draw them quickly, common mistakes to avoid, and how aspirants can practice this skill as part of a smart UPSC Preparation strategy.
Why Presentation Matters in UPSC Mains
UPSC Mains answers are evaluated under strict time constraints. Examiners often check hundreds of answer sheets, and clarity becomes critical.
A well-presented answer:
- Saves the examiner’s time
- Improves readability
- Highlights analytical ability
- Shows conceptual clarity
- Creates a positive impression
This is where diagrams and flowcharts become powerful tools.
What Are Diagrams & Flowcharts in the UPSC Context?
Diagrams
Simple visual representations such as:
- Maps
- Conceptual sketches
- Structural layouts
- Process diagrams
- Cause–and–effect illustrations
Flowcharts
Step-by-step representations showing:
- Processes
- Policy implementation
- Decision-making chains
- Cycles and feedback loops
- Institutional frameworks
Both tools aim to compress information without losing meaning.
Why UPSC Prefers Diagrams & Flowcharts
UPSC does not explicitly mention diagrams in its syllabus, yet toppers consistently use them. The reason is simple:
1. They Improve Answer Clarity
A diagram explains in 10 seconds what may take 5–6 lines to write.
2. They Save Time
With a limited word count (150–250 words), visuals help you cover more dimensions efficiently.
3. They Reflect Analytical Thinking
Flowcharts show logical sequencing, not rote memorization.
4. They Create Visual Anchors
Examiners remember visually strong answers better than plain text.
This is why reputed UPSC Coaching institutes, including The Prayas India, strongly emphasize diagram-based answer writing practice.
Where to Use Diagrams & Flowcharts in UPSC Mains

1. Geography (Highest Utility)
- River systems
- Monsoon mechanism
- Cyclones
- Plate tectonics
- Urban planning models
Example:
A simple India map for a question on drought-prone regions can fetch extra marks.
2. GS Paper II (Polity & Governance)
- Institutional frameworks
- Constitutional processes
- Federal structure
- Policy implementation models
Example:
A flowchart showing policy formulation → implementation → monitoring → outcomes strengthens governance answers.
3. GS Paper III (Economy, Environment, Security)
- Economic cycles
- Inflation transmission
- Disaster management cycle
- Internal security challenges
Example:
A circular flow diagram for Disaster Management (Prevention–Mitigation–Preparedness–Response–Recovery).
4. GS Paper IV (Ethics)
- Ethical decision-making models
- Stakeholder analysis
- Conflict resolution frameworks
Example:
A stakeholder diagram instantly improves case study answers.
5. Essay Paper (Selective Use)
Diagrams are rarely used, but conceptual flowcharts can be helpful in:
- Philosophical essays
- Governance or development themes
Types of Diagrams & Flowcharts You Should Master
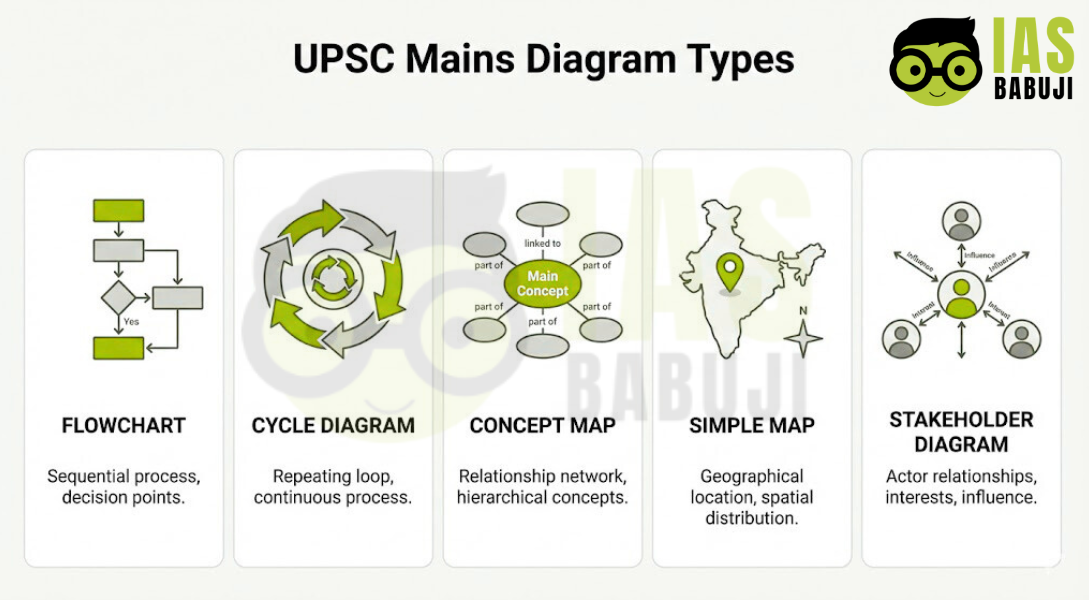
1. Flowcharts
Used for processes, policies, governance, and ethics.
2. Cycle Diagrams
Used in the environment, economy, and disaster management.
3. Concept Maps
Used for multi-dimensional analysis.
4. Simple Maps
Used in geography, environment, and international relations.
5. Tables + Diagrams Combo
Used for comparison and contrast questions.
How Diagrams Help in Time Management
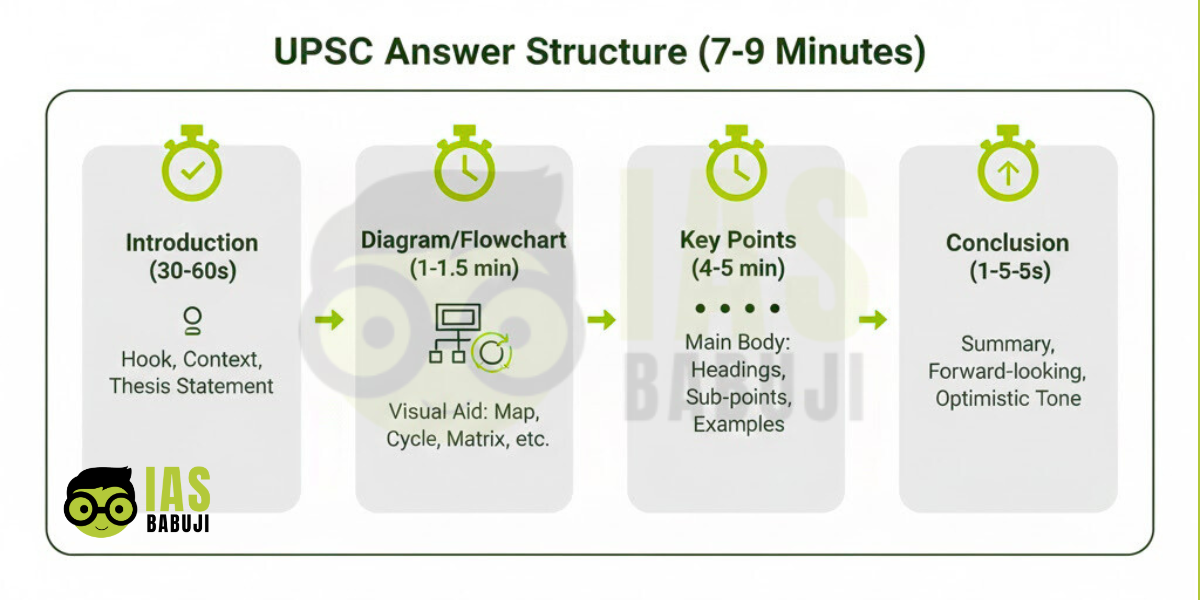
UPSC Mains gives:
- 7–9 minutes per answer
Instead of writing long paragraphs:
- Write 2–3 crisp points
- Add a small diagram or flowchart
- Conclude briefly
This structure helps aspirants complete the paper on time—a strategy frequently advised during UPSC Preparation classes at The Prayas India.
How to Draw Diagrams Quickly in the Exam
You don’t need artistic skills. Follow these rules:
Golden Rules
- Use a black pen only
- Keep diagrams simple and clean
- Avoid shading or colouring
- Label clearly
- Don’t overdraw
Time Limit
- The diagram should take 30–45 seconds, not more.
Common Mistakes Aspirants Make

- Overly complex diagrams
- Irrelevant visuals
- Poor labeling
- Using diagrams where not needed
- Spending too much time on visuals
Remember: Diagrams support content, they do not replace it.
How to Practice Diagram-Based Answer Writing
1. Learn Standard Diagrams
Maintain a notebook of ready-to-use diagrams for:
- Polity
- Economy
- Environment
- Ethics
2. Practice with PYQs
Rewrite previous year questions using diagrams.
3. Timed Answer Writing
Simulate exam conditions.
4. Get Feedback
Structured evaluation—often provided by quality UPSC Coaching programs like The Prayas India—helps correct mistakes early.
Toppers’ Strategy: What They Do Differently
- Pre-learn 40–50 common diagrams
- Use diagrams in the intro or body, not randomly
- Combine diagrams with keywords
- Keep diagrams examiner-friendly
This balanced approach significantly improves scores.
Are Diagrams Mandatory to Clear UPSC?
No.
But they can be a decisive advantage, especially when:
- Content is average
- Time is limited
- Competition is intense
In a rank-determined exam like UPSC, even 5–10 extra marks can change your final result.
Role of Coaching in Improving Diagram Skills
Self-study aspirants often know the content but struggle with presentation. Structured mentorship helps in:
- Learning where diagrams add value
- Avoiding overuse
- Improving speed and neatness
That’s why aspirants often rely on UPSC Preparation guidance from institutes like The Prayas India, where answer writing, diagrams, and feedback are integrated.
FAQs on Role of Diagrams & Flowcharts in UPSC Mains
1. Are diagrams allowed in UPSC Mains answers?
Yes, diagrams are completely allowed and widely used by toppers. UPSC does not restrict diagrams as long as they are relevant, simple, and enhance answer clarity.
2. Do diagrams really increase marks in UPSC Mains?
Diagrams do not guarantee marks, but they significantly improve answer presentation, readability, and clarity—often giving an edge over text-heavy answers.
3. In which GS papers are diagrams most useful?
Diagrams are most effective in GS Paper I (Geography), GS Paper II (Polity & Governance), GS Paper III (Economy, Environment, Security), and GS Paper IV (Ethics case studies).
4. How much time should be spent on drawing a diagram in the exam?
Ideally, a diagram or flowchart should take 30–45 seconds. Spending more time can affect answer completion.
5. Can diagrams replace written content in UPSC answers?
No. Diagrams should support written points, not replace them. A balanced combination of keywords, points, and visuals is ideal.
6. What type of diagrams should UPSC aspirants practice?
Aspirants should practice flowcharts, cycle diagrams, concept maps, simple maps, and stakeholder diagrams, especially those that can be reused across multiple questions.
7. Are diagrams useful in the UPSC Essay paper?
Diagrams are rarely used in essays, but conceptual flowcharts may be used sparingly for governance or philosophical topics if they add clarity.
8. Do I need coaching to learn diagram-based answer writing?
Coaching is not mandatory, but structured feedback helps aspirants understand where diagrams add value and where they don’t. Many rely on UPSC Preparation guidance from institutes like The Prayas India for this purpose.
9. What are the common mistakes while using diagrams in UPSC Mains?
Common mistakes include drawing overly complex diagrams, poor labeling, irrelevant visuals, and spending too much time on the presentation.
10. How can beginners start practicing diagrams for UPSC Mains?
Beginners should maintain a diagram notebook, practice with previous year questions, and include at least one diagram in daily answer writing practice.

Conclusion
The role of diagrams and flowcharts in UPSC Mains cannot be overstated. They are not decorative tools but strategic instruments that enhance clarity, improve time management, and boost examiner engagement.
In an exam where thousands write similar answers, visual presentation becomes your silent differentiator.
Remember:
“UPSC rewards clarity, not complexity.”
Integrate diagrams wisely, practice consistently, and make them a natural part of your UPSC Mains strategy.


